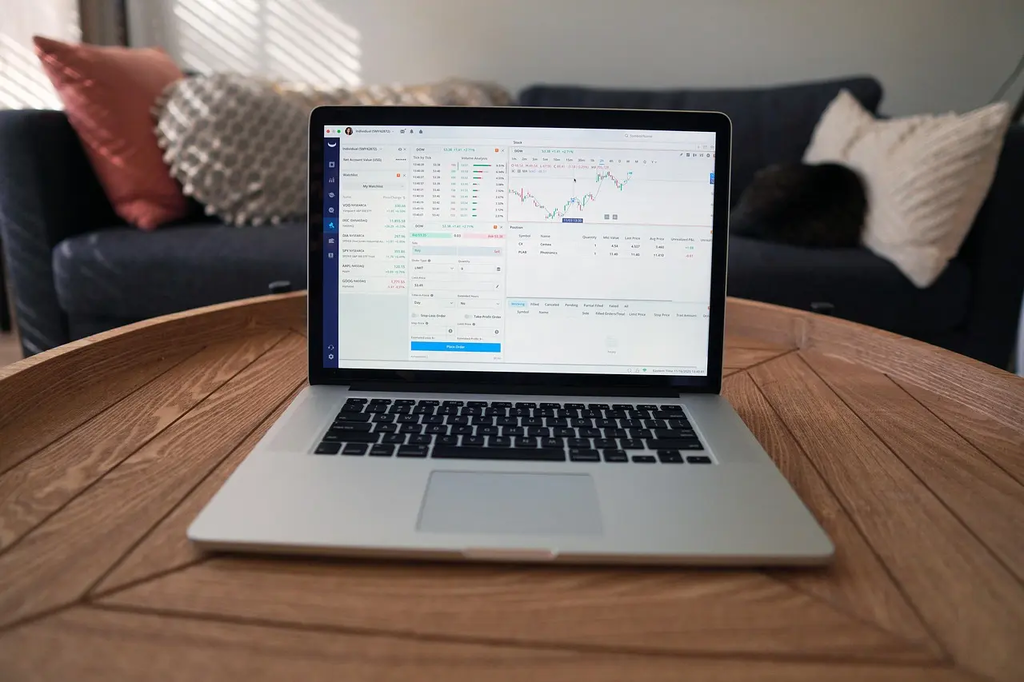
Analyzing stock market trends in the US involves examining historical price movements, trading volumes, and market indicators to identify patterns and predict future performance. This process often includes technical analysis, studying charts and trends, as well as fundamental analysis, which evaluates economic data, company earnings, and industry news. By understanding these trends, investors and traders make informed decisions to maximize profits and minimize risks in the dynamic US stock markets.
Analyzing Stock Market Trends
Analyzing stock market trends in the US involves examining historical price movements, trading volumes, and market indicators to identify patterns and predict future performance. This process often includes technical analysis, studying charts and trends, as well as fundamental analysis, which evaluates economic data, company earnings, and industry news. By understanding these trends, investors and traders make informed decisions to maximize profits and minimize risks in the dynamic US stock markets.

💡 Key Takeaways
- Identify and interpret common indicators for stock trends (e.g., moving averages, RSI, MACD).
- Differentiate between uptrends, downtrends, and sideways trends and learn how to confirm them.
- Use trend lines, support, and resistance to spot potential reversals and continuations.
- Evaluate trading volume to confirm trend strength and beware common pitfalls in trend analysis.
❓ Frequently Asked Questions
What does stock market trend analysis mean?
It is the process of identifying the overall direction of price movements (up, down, or sideways) to guide trading decisions.
What is a trend line and what does it show?
A trend line is a straight line drawn on a price chart that connects highs or lows to reveal the current direction and potential support or resistance.
Which indicators are commonly used to identify trends?
Moving averages smooth price data to show the trend, while momentum tools like MACD or RSI help gauge strength and potential reversals.
How can you spot a trend reversal?
Look for breaks of key trend lines or moving averages and signals from momentum indicators that suggest momentum is shifting.
What is the difference between technical and fundamental trend analysis?
Technical analysis uses price action and indicators to infer trends, while fundamental analysis examines company and macro factors to explain long-term directions.