Fatigue basics refer to the study of how materials weaken and eventually fail under repeated cyclic loading, even if the stresses are below their ultimate strength. S–N curves, or stress-number curves, graphically represent the relationship between the applied stress amplitude (S) and the number of cycles to failure (N). These curves help engineers predict a material's fatigue life and are essential in designing components to withstand fluctuating loads over time without unexpected failure.
Fatigue Basics and S–N Curves
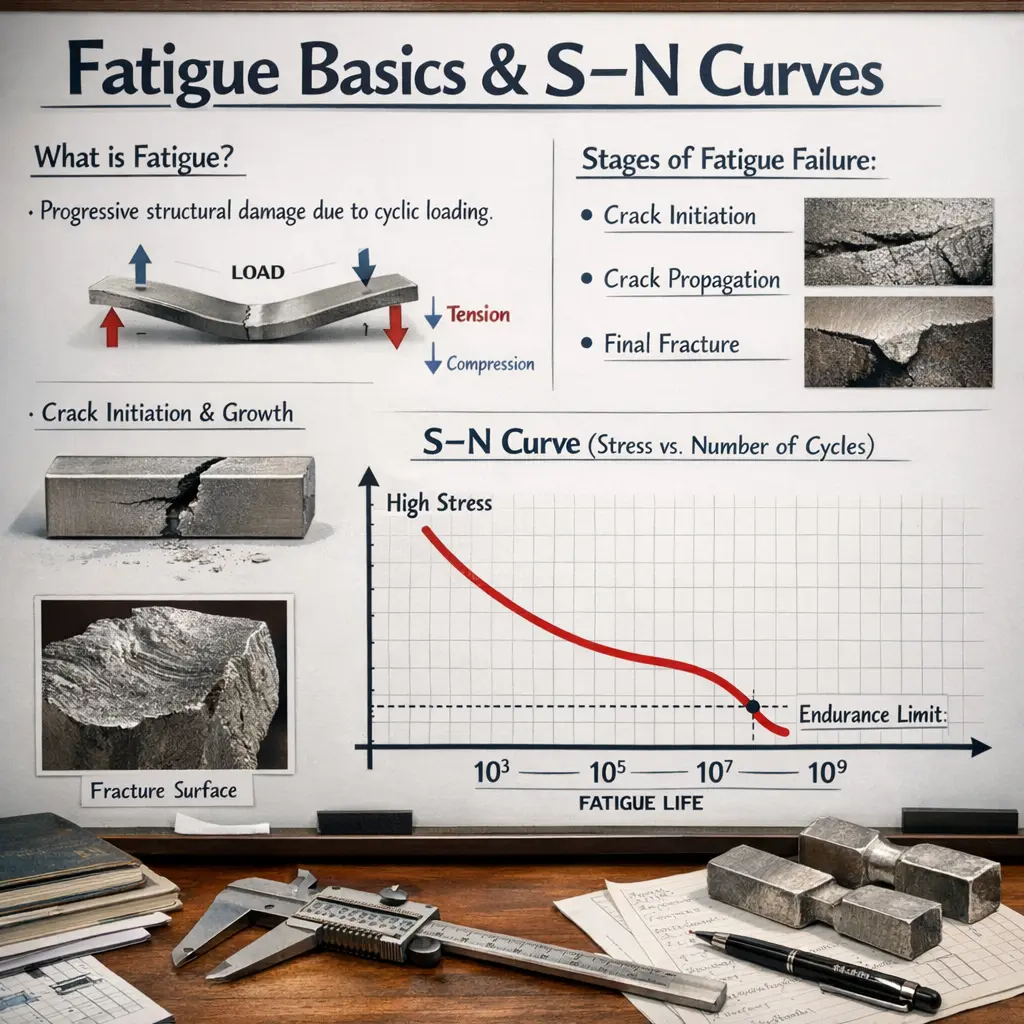
Fatigue basics refer to the study of how materials weaken and eventually fail under repeated cyclic loading, even if the stresses are below their ultimate strength. S–N curves, or stress-number curves, graphically represent the relationship between the applied stress amplitude (S) and the number of cycles to failure (N). These curves help engineers predict a material's fatigue life and are essential in designing components to withstand fluctuating loads over time without unexpected failure.
💡 Key Takeaways
- Explain fatigue as failure due to repeated cyclic loading and why it matters for real-world parts.
- Read and interpret an S-N (Wöhler) curve to relate stress amplitude to cycles to failure.
- Differentiate high-cycle fatigue from low-cycle fatigue and typical stress ranges.
- Identify key fatigue-influencing factors (surface finish, mean stress, temperature, environment) and basic mitigation strategies.
❓ Frequently Asked Questions
What is fatigue in materials science?
Fatigue is failure that occurs after repeated cyclic loading, due to crack initiation and growth, even when peak stress is below the material's static strength.
What is an S-N curve?
An S-N curve plots stress amplitude against the number of cycles to failure, showing how long a component can endure cyclic loading before failing.
What factors influence fatigue life?
Fatigue life depends on material properties (microstructure, surface finish), loading type and mean stress, environment and temperature, size, and stress concentrators like notches.
How do you interpret an S-N curve?
Locate the stress level on the y-axis and read the corresponding cycles to failure on the x-axis. Operating below the curve suggests acceptable life; above it, failure is likely sooner. Some materials have a fatigue limit (endurance at low stress).