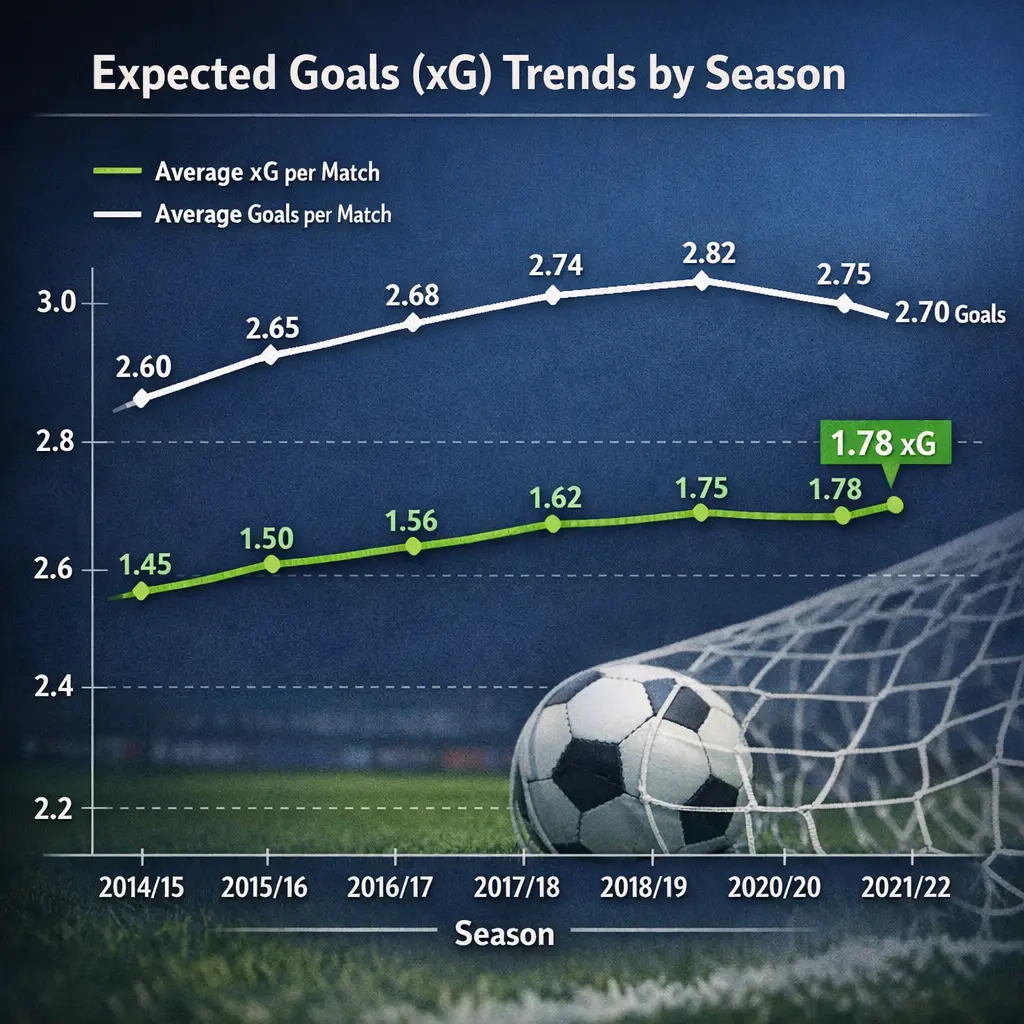
"Expected Goals (xG) Trends by Season (Chelsea F.C.)" refers to the analysis of Chelsea Football Club’s attacking performance over multiple seasons using the xG metric. This metric estimates the quality of goal-scoring chances and the likelihood of scoring based on factors like shot location and type. Tracking xG trends by season provides insights into Chelsea’s offensive efficiency, tactical changes, and overall team progression or regression in creating high-quality chances.
Expected Goals (xG) Trends by Season
"Expected Goals (xG) Trends by Season (Chelsea F.C.)" refers to the analysis of Chelsea Football Club’s attacking performance over multiple seasons using the xG metric. This metric estimates the quality of goal-scoring chances and the likelihood of scoring based on factors like shot location and type. Tracking xG trends by season provides insights into Chelsea’s offensive efficiency, tactical changes, and overall team progression or regression in creating high-quality chances.
💡 Key Takeaways
- Understand what xG (expected goals) is and why it matters when evaluating seasons.
- Explore how season-to-season changes in xG reflect shifts in attacking quality and shot quality.
- Learn to compare xG trends with actual goals to judge over- or under-performance across seasons.
- Be aware of limitations when interpreting seasonal xG trends (penalty impacts, sample size, league context).
❓ Frequently Asked Questions
What is expected goals (xG) and what does it measure?
xG estimates the probability that a given shot becomes a goal based on factors like location, angle, and shot type. It gauges chance quality, not just whether a goal occurred.
Why do xG trends change across seasons?
Seasonal shifts in tactics, player quality, shooting decisions, and defensive strength can alter the quality and volume of chances. Data collection methods and league-wide changes also influence xG trends.
How can season-by-season xG trends help evaluate teams or leagues?
Compare xG per game or per 90 with actual goals to assess finishing efficiency. A rising xG with rising goals suggests better finishing; a rising xG with few goals may indicate poor finishing or luck.
What are common limitations of using xG trends?
Models vary, not all shot context is captured, penalties and set-pieces may be treated differently, and data quality or game context (injuries, schedule) can affect results. xG is informative but not perfect.