Monitoring dashboards and alerts for Retrieval-Augmented Generation (RAG) systems provide real-time oversight of both retrieval and generation components. Dashboards visualize key metrics such as query latency, retrieval accuracy, and generation quality, enabling teams to track system health and performance. Alerts notify operators of anomalies or failures, such as increased error rates or degraded response times, ensuring rapid response to issues and maintaining the reliability and effectiveness of RAG-powered applications.
Monitoring Dashboards and Alerts for Retrieval and Generation
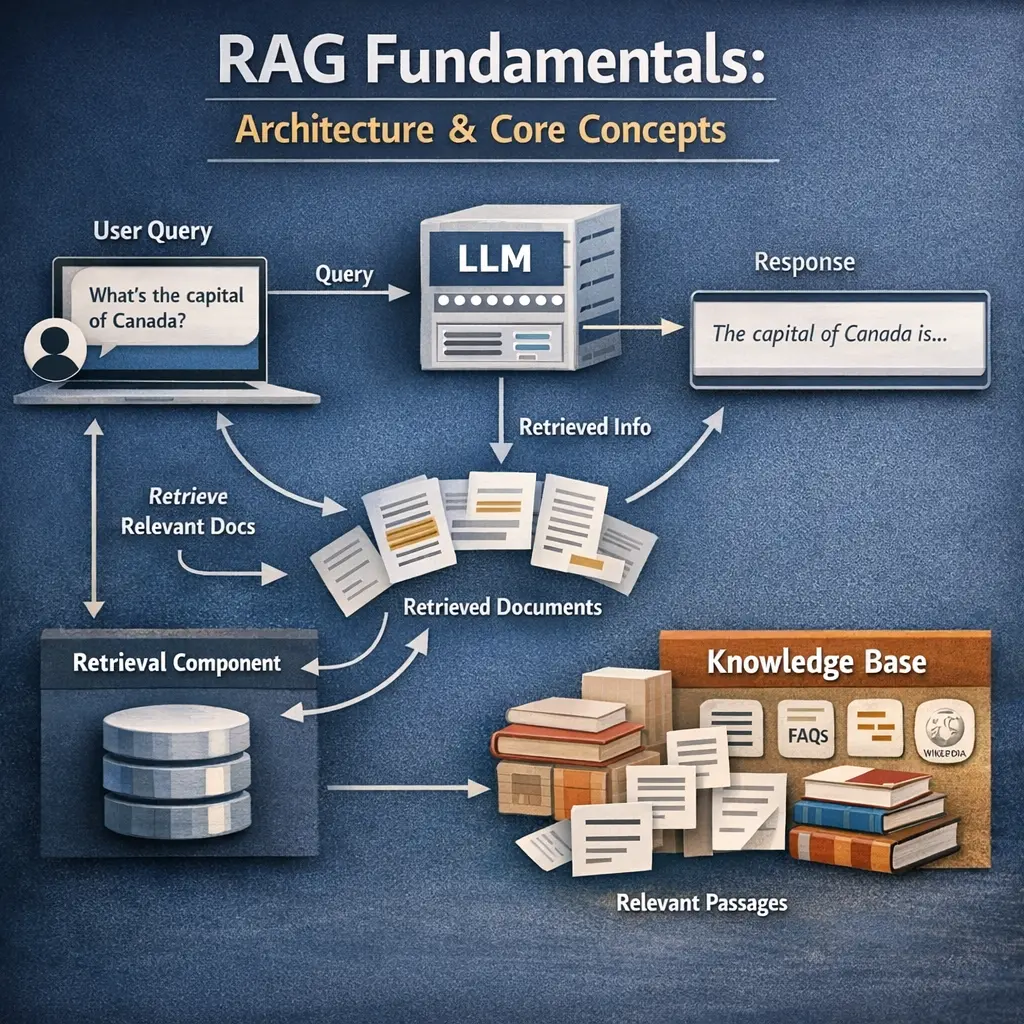
Monitoring dashboards and alerts for Retrieval-Augmented Generation (RAG) systems provide real-time oversight of both retrieval and generation components. Dashboards visualize key metrics such as query latency, retrieval accuracy, and generation quality, enabling teams to track system health and performance. Alerts notify operators of anomalies or failures, such as increased error rates or degraded response times, ensuring rapid response to issues and maintaining the reliability and effectiveness of RAG-powered applications.

💡 Key Takeaways
- Understand the role of dashboards and alerts in an end-to-end retrieval and generation workflow.
- Monitor retrieval metrics: latency, throughput, relevance (precision@k/recall@k), data freshness, and failure rate.
- Monitor generation metrics: latency, token usage/cost, output quality indicators, and error rate.
- Set meaningful thresholds and alert rules to detect degradation while minimizing alert fatigue.
- Use dashboards to diagnose issues by correlating signals across retrieval and generation stages.
❓ Frequently Asked Questions
What is a monitoring dashboard in the context of retrieval and generation?
A dashboard visualizes key metrics for both data retrieval and content generation, helping you spot performance issues, track data freshness, and understand system health at a glance.
What metrics should you monitor for data retrieval?
Data freshness (staleness), retrieval latency, success rate, error types, cache hits, and throughput to ensure timely and complete data delivery.
What metrics should you monitor for content generation?
Generation latency, token usage, output quality, hallucination rate, safety/flagging events, and error rates to assess accuracy and reliability.
How do you configure effective alerts for dashboards?
Set clear thresholds, define multi-level severity, avoid alert fatigue, correlate related metrics, and route alerts with runbooks to on-call staff for fast remediation.