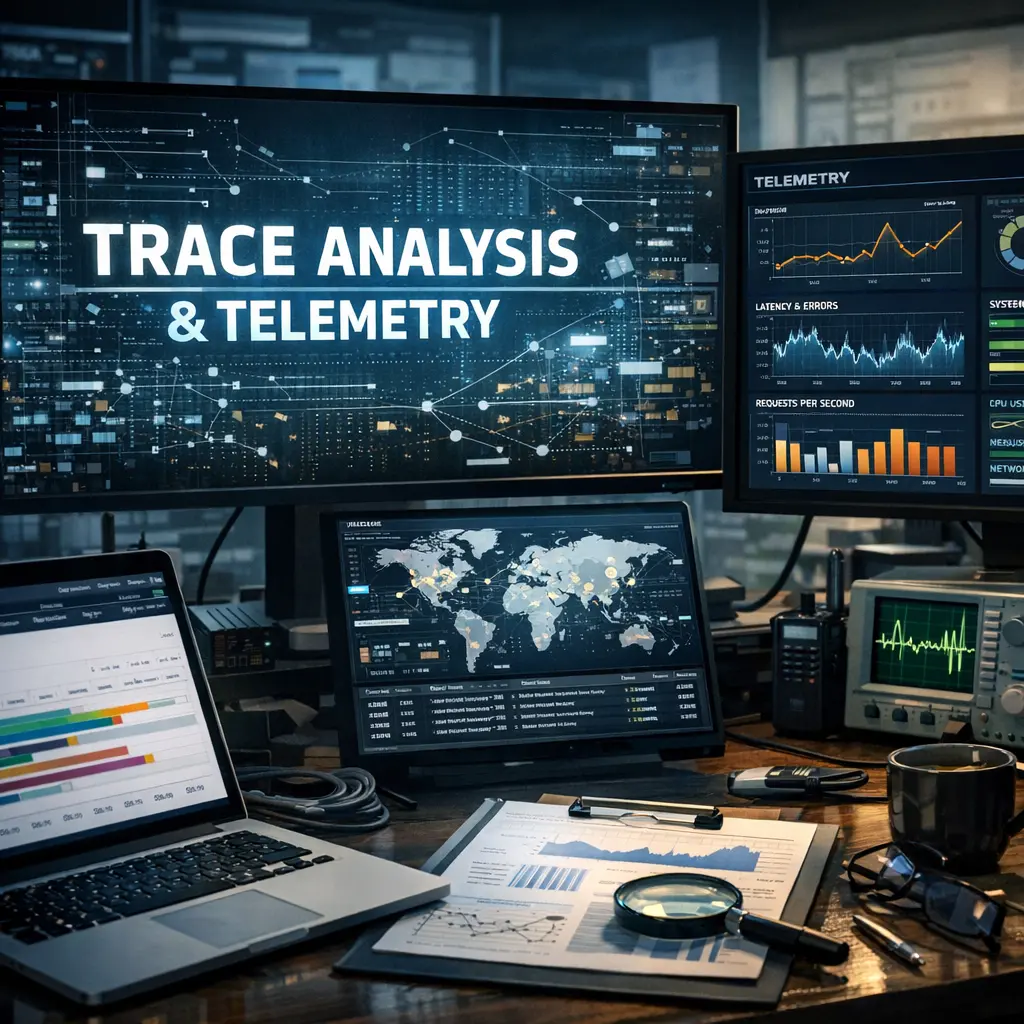
Trace Analysis & Telemetry (Agent Architecture) refers to a system design where specialized software agents are deployed within an application or infrastructure to collect, monitor, and analyze trace data and telemetry. These agents capture detailed information about application performance, transactions, errors, and resource usage. The collected data is then processed and transmitted to centralized platforms for real-time monitoring, diagnostics, and optimization, enabling proactive issue detection and improved system reliability.
Trace Analysis & Telemetry
Trace Analysis & Telemetry (Agent Architecture) refers to a system design where specialized software agents are deployed within an application or infrastructure to collect, monitor, and analyze trace data and telemetry. These agents capture detailed information about application performance, transactions, errors, and resource usage. The collected data is then processed and transmitted to centralized platforms for real-time monitoring, diagnostics, and optimization, enabling proactive issue detection and improved system reliability.
💡 Key Takeaways
- Understand the purpose of trace analysis and telemetry in diagnosing system performance.
- Distinguish between traces, metrics, and logs and how they complement each other.
- Learn how to collect, propagate, and visualize trace data across distributed components.
- Identify common latency bottlenecks by analyzing spans, trace IDs, and dependency graphs.
- Explore standard tooling and formats (OpenTelemetry, Jaeger, Zipkin) and best practices for instrumentation.
❓ Frequently Asked Questions
What is trace analysis and how does it relate to telemetry?
Trace analysis studies how requests move through a system by examining distributed traces; telemetry is the broader practice of collecting traces, metrics, and logs to monitor performance and behavior.
What is a trace vs a span in distributed tracing?
A trace is the full end-to-end request path, while a span represents a single operation within that path with its timing and metadata.
What are the main types of telemetry data and what does each show?
Traces reveal request flow and latency, metrics provide aggregated measurements (e.g., throughput, error rate), and logs capture detailed events for debugging.
How can trace analysis help identify bottlenecks?
By visualizing traces, you can spot long-running spans, slow dependencies, or erroring components, guiding targeted optimizations.